Unit-V: Non-linear Pharmacokinetics (07 Hrs.)
Syllabus
Nonlinear Pharmacokinetics: a. Introduction, b. Factors causing Non-linearity. c. Michaelis-menton method of estimating parameters, Explanation with example of drugs.

Introduction:
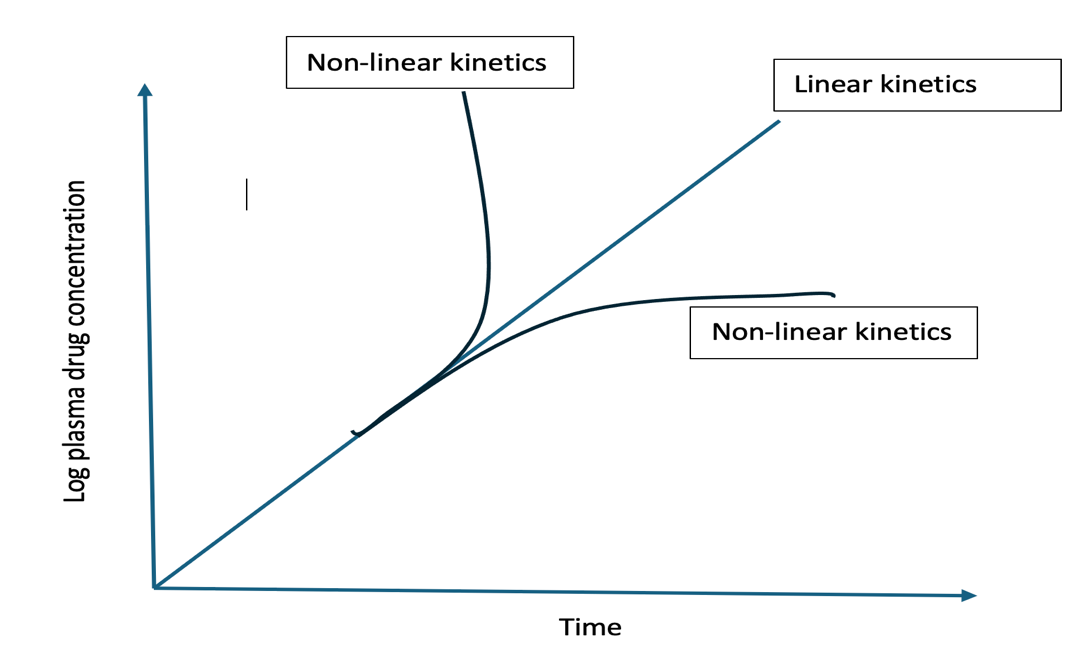
- In most cases, at therapeutic doses, the change in the amount of drug in the body or the change in its plasma concentration due to absorption, distribution, binding, metabolism or excretion, is proportional to its dose, whether administered as a single dose or as multiple doses.
- In such situations, the rate processes are said to follow first-order or linear kinetics and all semilog plots of C versus t for different doses, when corrected for dose administered, are superimposable. This is called as principle of superposition. The important pharmacokinetic parameters viz. F, Ka, KE, Vd, ClR and ClH which describe the time-course of a drug in the body remain unaffected by the dose i.e. the pharmacokinetics is dose-independent.
- In some instances, the rate process of a drug’s ADME are dependent upon carrier or enzymes that are substrate-specific, have definite capacities, and susceptible to saturation at high drug concentration. In such cases, an essentially first-order kinetics transform into a mixture of first-order and zero-order rate processes and the pharmacokinetic parameters change with the size of the administered dose. The pharmacokinetics of such drugs are said to be dose-dependent. Other terms synonymous with it are mixed-order, nonlinear and capacity-limited kinetics. Drugs exhibiting such a kinetic profile are sources of variability in pharmacological response.
- Definition: Non-linear pharmacokinetics occurs when the relationship between a drug’s dose and its resulting concentration in the body is not proportional. If the dose is doubled, the concentration may disproportional spike or drop, because the body’s mechanisms for absorption, distribution, or clearing the drug become saturated.
- Non-linear pharmacokinetics is called dose-dependent kinetics because pharmacokinetic parameters—like how fast a drug is processed, cleared, or removed from the body—change depending on the size of the dose you take.
- If you double the dose, the blood concentration might triple or quadruple. The drug processing systems get overloaded, meaning the body’s rate of eliminating or distributing the drug is not fixed, but instead depends heavily on how much drug is introduced.
- There are several tests to detect nonlinearity in pharmacokinetics but the simplest ones are –
- Determination of steady-state plasma concentration at different doses. If thesteady-state concentrations are directly proportional to the dose, then linearity in the kinetics exists. Such proportionality is not observable when there is nonlinearity.
- Determination of some of the important pharmacokinetic parameters such asfraction bioavailable, elimination half-life or total systemic clearance at different doses of the drug. Any change in these parameters which are usually constant, is indicative of nonlinearity.
Causes of Non-Linearity
Nonlinearities can occur in drug absorption, distribution, metabolism and excretion.
Drug Absorption
Nonlinearity in drug absorption can arise from 3 important sources –
- When absorption is solubility or dissolution rate-limited e.g. griseofulvin. At higher doses, a saturated solution of the drug is formed in the GIT or at any other extravascular site and the rate of absorption attains a constant value.
- When absorption involves carrier-mediated transport systems e.g. absorption of riboflavin, ascorbic acid, cyanocobalamin, etc. Saturation of the transport system at higher doses of these vitamins results in nonlinearity.
- When presystemic gut wall or hepatic metabolism attains saturation e.g. propranolol, hydralazine and verapamil. Saturation of presystemic metabolism of these drugs at high doses leads to increased bioavailability.
The parameters affected will be F, Ka, Cmax and AUC. A decrease in these parameters is observed in the dissolution rate-limited and carrier-mediated transport system cases and an increase in the presystemic gut wall attains saturation case. Other causes of nonlinearity in drug absorption are changes in gastric emptying and GI blood flow and other physiologic factors. Nonlinearity in drug absorption is of little consequence unless availability is drastically affected.
Drug Distribution
Nonlinearity in distribution of drugs administered at high doses may be due to –
- Saturation of binding sites on plasma proteins e.g. phenylbutazone and naproxen. There is a finite number of binding sites for a particular drug on plasma proteins and, theoretically, as the concentration is raised, so too is the fraction unbound.
- Saturation of tissue binding sites e.g. thiopental and fentanyl. With large single bolus doses or multiple dosing, saturation of tissue storage sites can occur.
In both cases, the free plasma drug concentration increases but Vd increases only in the former case whereas it decreases in the latter. Clearance is also altered depending upon the extraction ratio of the drug.
Drug Metabolism
Two important causes of nonlinearity in metabolism are –
- Capacity-Limited Enzymes: Hepatic (liver) enzymes that metabolize drugs have a maximum processing capacity (𝑉𝑚𝑎𝑥). At low doses, clearance is proportional to concentration. At higher doses, the enzyme system saturates, causing the drug to accumulate rapidly in the body.
- Enzyme Induction or Inhibition: Certain drugs can cause the liver to produce more enzymes (auto-induction) or block enzyme activity, which decreases or increases drug concentrations respectively over time.
Saturation of enzyme results in decreased ClH and therefore increased Css. Reverse is true for enzyme induction.
Drug Excretion
The two active processes in renal excretion of a drug that are saturable are –
- Active Tubular Secretion: The kidneys actively secrete certain drugs into the urine via transporter systems. These carriers have a limited capacity and can become saturated at high drug loads. E.g. penicillin G
- Active Tubuar Reabsorption: Carrier mediated transporters that pull useful substances back from the urine into the blood can also become saturated, an increase in renal clearance occurs.
Other sources of nonlinearity in renal excretion include forced diuresis, changes in urine pH, nephrotoxicity and saturation of binding sites.
Biliary secretion, which is also an active process, is also subject to saturation e.g. tetracycline and indomethacin.
Examples of the drugs which follow non-linear pharmacokinetics.
| Cause | Drug |
|---|---|
| GI Absorption | |
| Saturable transport in gut wall | Riboflavin, gebapentin, l-dopa, baclofen, ceftibuten |
| Intestinal metabolism | Salicylamide, propranolol |
| Drugs with low solubility in GI but relatively high dose | Chorothiazide, griseofulvin, danazol |
| Saturable gastric or GI decomposition | Penicillin G, omeprazole, saquinavir |
| Distribution | |
| Saturable plasma protein binding | Phenylbutazone, lidocaine, salicylic acid, ceftriaxone, diazoxide, phenytoin, warfarin, disopyramide |
| Cellular uptake | Methicillin (rabbit) |
| Tissue binding | Imiprimine (rat) |
| CSF transport | Benzylpenicillins |
| Saturable transport into or out of tissues | Methotrexate |
| Metabolism | |
| Saturable metabolism | Phenytoin, salicyclic acid, theophylline, valproic acidb |
| Cofactor or enzyme limitation | Acetaminophen, alcohol |
| Enzyme induction | Carbamazepine |
| Altered hepatic blood flow | Propranolol, verapamil |
| Metabolite inhibition | Diazepam |
| Renal Elimination | |
| Active secretion | Mezlocillin, para-aminohippuric acid |
| Tubular reabsorption | Riboflavin, ascorbic acid, cephapirin |
| Change in urine pH | Salicylic acid, dextroamphetamine |
MICHAELIS MENTEN EQUATION
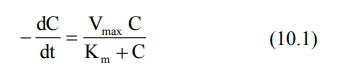
The kinetics of capacity-limited or saturable processes is best described by Michaelis-
Menten equation:
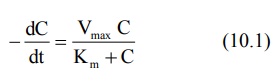
Where,
–dC/dt = rate of decline of drug concentration with time,
Vmax = theoretical maximum rate of the process,
C= Concentration of drug in plasma and
Km = Michaelis constant.
Four situations can now be considered depending upon the values of Km and C:
1. When Km = C
Under this situation, the equation 10.1 reduces to:
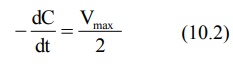
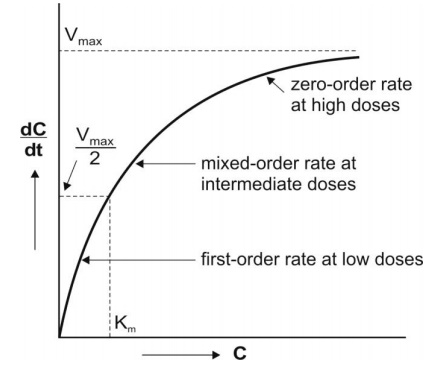
This indicates that, when Km = C, the rate of process is equal to one-half its maximum rate (Fig. 10.1).
2. When Km >> C
Here, Km + C ≡ Km and the equation 10.1 reduces to:
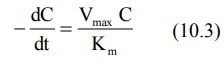
As we know Vmax/Km = KE, the equation 10.3 will become,
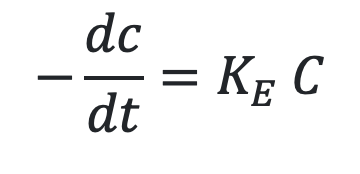
The above equation is identical to the one that describes first-order elimination of a drug.
This means that the drug concentration in the body that results from usual dosage regimens of most drugs is well below the Km of the elimination process with certain exceptions such as phenytoin and alcohol.
3. When Km & C, Both are significant
Under this condition, Km + C ≡ C and the equation 10.1 will remain as such:
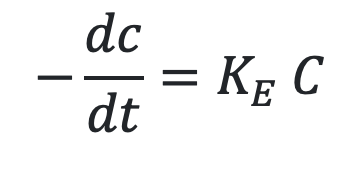
It indicates, at this stage, the rate is both dependent and independent on the concentration of the drug that means mixed order kinetics.
4. When Km << C
Under this condition, Km + C ≡ C and the equation 10.1 will become:
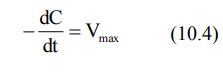
The above equation is identical to the one that describes a zero-order process i.e. the rate process occurs at a constant rate Vmax and is independent of drug concentration e.g. metabolism of ethanol.
Estimation of Km and Vmax (i.v bolus)
Practically, one can graphically compute Km and Vmax in 3 ways:
- Lineweaver-Burke Plot/Klotz plot
- Direct Linear Plot and
- Graphical method.
We will go with a Graphical method.
Graphical method of Estimation of Km and Vmax
The parameters of capacity-limited processes like metabolism, renal tubular secretion and biliary excretion can be easily defined by assuming one-compartment kinetics for the drug and that elimination involves only a single capacity-limited process.
The parameters Km and Vmax can be assessed from the plasma concentration-time data collected after i.v. bolusadministration of a drug with nonlinear elimination characteristics.
Rewriting equation 10.1.
Integration of above equation followed by conversion to log base 10 yields:

A semilog plot of C versus t yields a curve with a terminal linear portion having slope –Vmax/2.303Km and when back extrapolated to time zero gives Y-intercept log Bar C0 () (see Fig. 10.2). The equation that describes this line is:
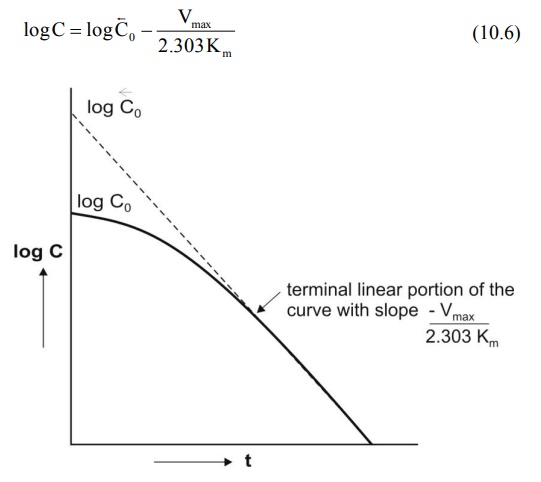
At low plasma concentrations, equations 10.5 and 10.6 are identical. Equating the two and simplifying further, we get:
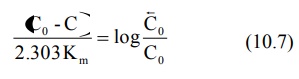
Km can thus be obtained from above equation. Vmax can be computed by substituting the value of Km in the slope value.
Estimation of Km and Vmax from Steady-State Concentration (i.v infusion)
Graphical method of Estimation of Km and Vmax
When a drug is administered as a constant rate i.v. infusion or in a multiple dose regimen, the steady-state concentration Css is given in terms of dosing rate DR as:
DR = CssClT (10.11)
Where, DR = dosing rate and ClT total clearance.
At steady-state, the dosing rate equals rate of decline in plasma drug concentration and if the decline (elimination) is due to a single capacity-limited process (for e.g. metabolism), then;
Michaeli’s-Menten equation,
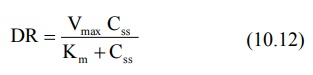
Can be written as,
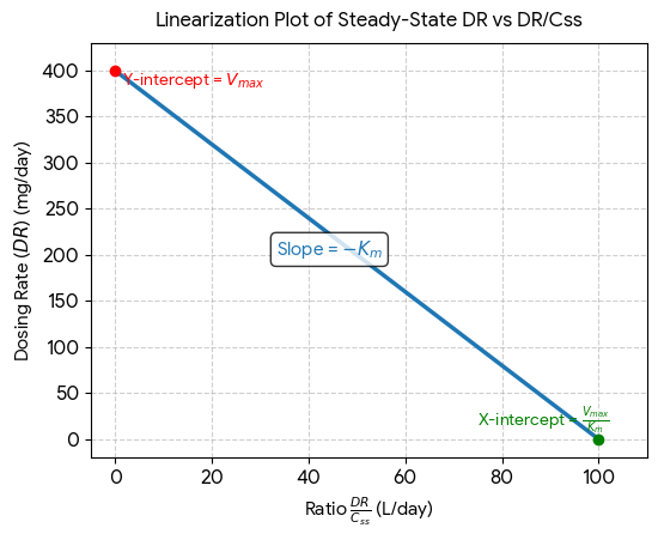
We need to rearrange the above equation as Y=mx+c for drawing a linear graphTherefore, equation10.12 becomes,
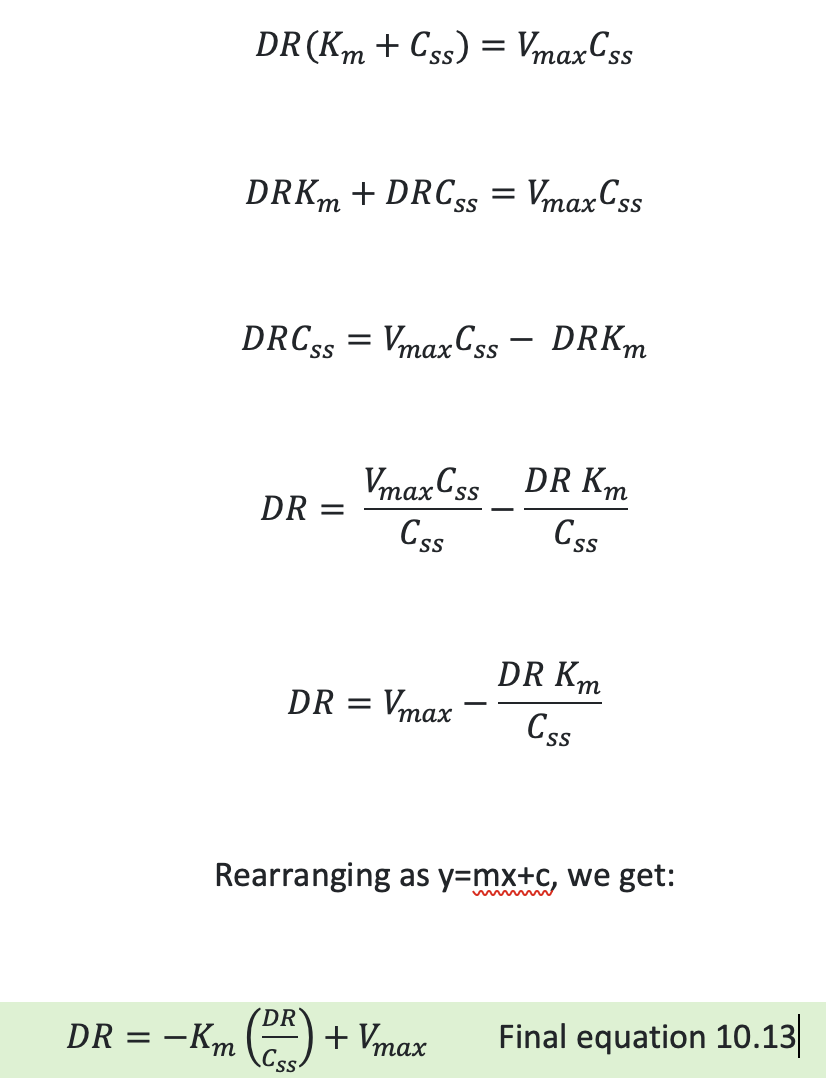
A plot of DR versus DR/Css yields a straight line with slope -Km and Y-intercept Vmax